Mapping a Social Network
Today, I am going to show you how to map a social network using NodeXL and Gephi. These are open source and free software packages that you can install on your PC (NodeXL runs only on PC) or Mac (Gephi runs on PC and Mac). There are many reasons you might want to map a social network. You may want to see if a particular group of Twitter users all talk to each other, or whether they form groups that talk among themselves but not with users in another group or community. You may want to see how Twitter users mentioning a particular hashtag are related to one another - are people using the hashtag talking to each other (like people who use the #scicomm hashtag), or mostly just mentioning the hashtag without talking to one another (like a bunch of different people using the hashtag #SB49 or #Starbucks)? The following video gives a great introduction to social network mapping and NodeXL.
https://www.youtube.com/watch?v=b5RonanIOF8
So do you want to map a social network all by yourself? Once you have NodeXL and/or Gephi installed, proceed with the following steps:
Open NodeXL – an add-in that runs in Excel.
Go to import > Twitter search network or Twitter users network. I’m going to important a Users network for Twitter users I’ve included in a Twitter list called WomenTweetScienceToo.
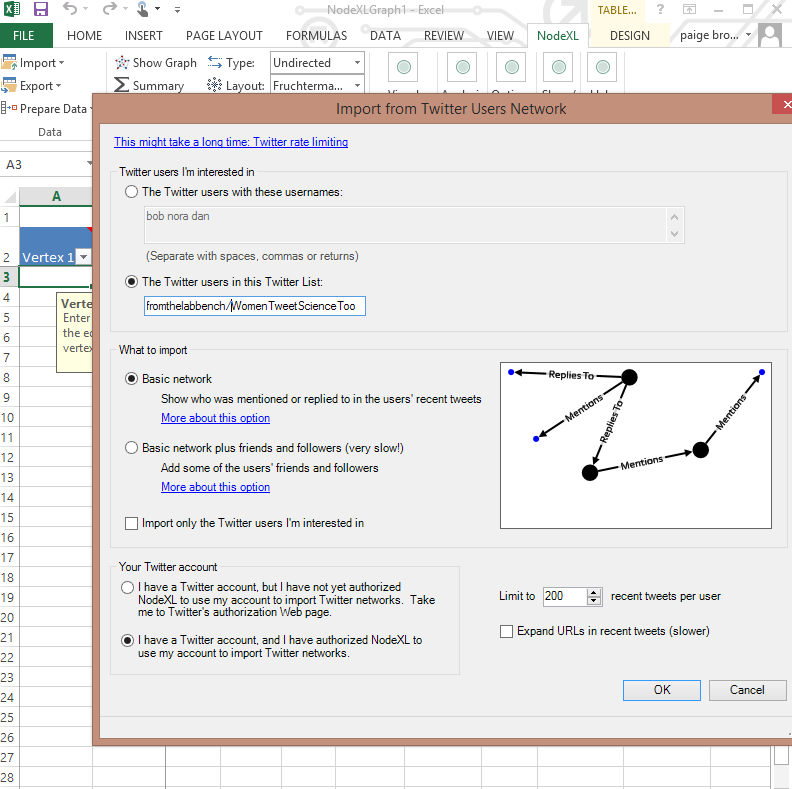
For now, I’m just going to ask NodeXL to show me the basic network for the last 200 tweets. I could ask for the basic network plus twitter users not in the network whom the users listed in WomenTweetScienceToo are interacting with. Collecting this data, however, may take NodeXL quite some time, so be prepared to wait a bit.
Click OK. (Note – you need to have a Twitter account and to have authorized NodeXL to use this account. I have already done this)
When the data is imported, it will look something like this:

A vertex, or node, is created for every user in the network. In this case, there is a node, or vertex (which you can see in the ‘Vertices’ tab at the bottom of the NodeXL spreadsheet) for every Twitter user in the WomenTweetScienceToo list. In the ‘edges’ tab, you’ll see that an edge has been created for each time a given Twitter user mentioned, replied to, retweeted, etc. another Twitter user in the network, or even a Twitter user not in the network if we chose to import Twitter users other than the ones listed directly in the Twitter list WomenTweetScienceToo.
Now there is a way to visualize this network in NodeXL. Just click ‘show graph’ at the top of the NodeXL spreadsheet. However, I prefer to visualize the network in Gephi. So at this point, go to Export > GraphML file, and save your NodeXL as a graphML file somewhere on your computer. You can now close out NodeXL.
Now, open Gephi. When Gephi opens, click “Open Graph File…” under New Project. Navigate to the graphML file you just saved. Gephi will prompt you when you load the graphML file, and ask things like what type of graph you are importing. In this case, I want a “directed” graph type, because my edges are directed – if I tweet to you, an arrow goes from me to you, but if you tweet to me, and arrow goes from you to me, and these are not the same things. Other types of social network relationships are not directed, i.e. Facebook friends.
Click OK to load your social network.

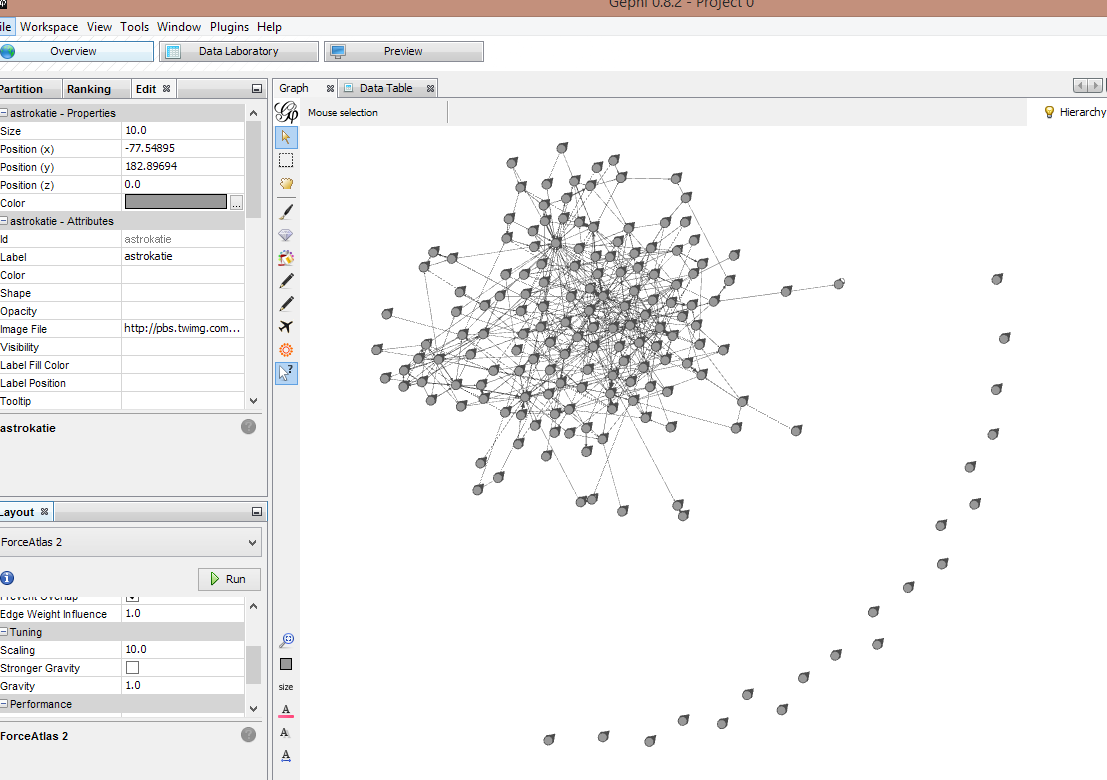
Right now, your network might look like a big hairball. But with Gephi’s algorithms, we can lay this network out so that the relationships between the nodes, or the links between the Twitter users represented as dots, are more apparent.
Go to Layout in the lower left-hand corner. Choose a layout. ForceAtlas2 is a great layout algorithm for Twitter networks and other directed networks.
"ForceAtlas2 is a force directed layout: it simulates a physical system in order to spatialize a network. Nodes repulse each other like charged particles, while edges attract their nodes, like springs. These forces create a movement that converges to a balanced state. This final configuration is expected to help the interpretation of the data." - Plos One

Sometimes you have to play with the layout a bit to make your network more easily interpretable. For example, it looks like in this network I have a very dense core of connected users. So I might want to select ‘prevent overlap’ so I can better see the nodes, and increase the ‘scaling’ (how much repulsion do you want between nodes that are not connected to others?) to 10, so that the dense core is more spread out.
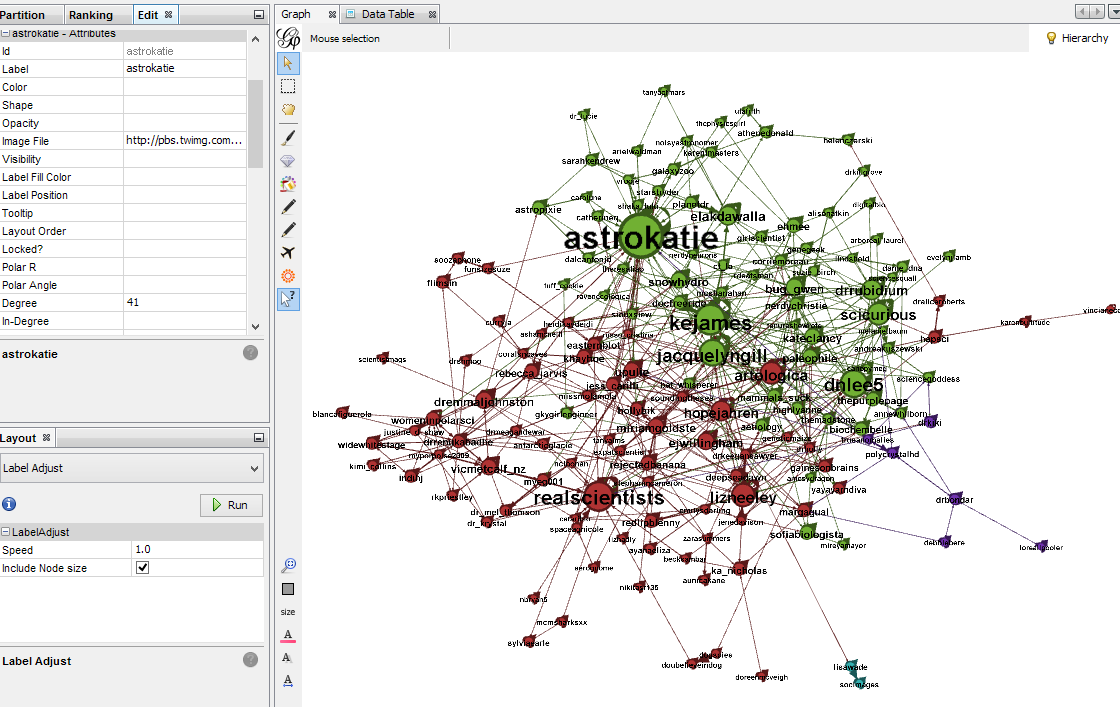
Now we can start to see that there are a collection of Twitter users in this list that are off on their own, not mentioning, replying to, or retweeting other users included in this WomenTweetScienceToo list. However, most of the women included in this list form a tightly connected core, tweeting at, replying, or retweeting one another.
Now, on the right hand side under ‘statistics,’ click the run button next to “average degree”. After you do this, go to the left hand side of the Gephi display and find the tab called ‘Ranking. If you click the refresh button under Ranking > Nodes, you’ll see several options for ranking the nodes in the network by degree, in-degree, out-degree, etc. The degree of a node is the number of links that are coming into and out of the node. If today I tweet to one person, and three other Twitter users reply to me, then my degree is 4 for today. The in-degree of a node is exactly what is sounds like – how many other nodes, or Twitter users, are replying, mentioning, tweeting to, or otherwise directing attention to this specific node. In the example I just gave, my in-degree would be 3 (three other Twitter users replying to me) and my out-degree would be 1 (I replied to one other person).

Under the Ranking > Nodes tab, select ‘in-degree’ and click on the little icon that looks like a diamond. Now, if you click Apply, Gephi will resize each node according to its in-degree. You can change the sizing range so that it best fits your network.

Now we can really see something going on here. A few of the nodes are much bigger than the other nodes, meaning that they got mentioned (tweeted at, replied to, retweeted, etc.) much more often in the time-frame that this network captures. In NodeXL, I selected to collect data based on the last 100 tweets of every user in the WomenTweetScienceToo list – so the time-frame captured by this network is approximately the last few days or so, if users are tweeting about 20-50 times a day.
Now we might want to know WHO the larger nodes are – who are the Twitter users who are getting the attention in this network graph? If you look at the bottom of your graph view, you’ll see an icon that looks like a ‘T’. If you click this, the node labels will appear (i.e. the Twitter username handles in this case). They are probably way too big, so you can resize them with the ‘A’ font-size sliding bar, also at the bottom of the graph view. If you want, you can actually size the node labels according to in-degree, just like we did for the node (dot) sizes. Just go back to Ranking > Nodes, and instead of selecting the icon that looks like a diamond, select the icon that looks like an ‘A’ with a diamond at the top.
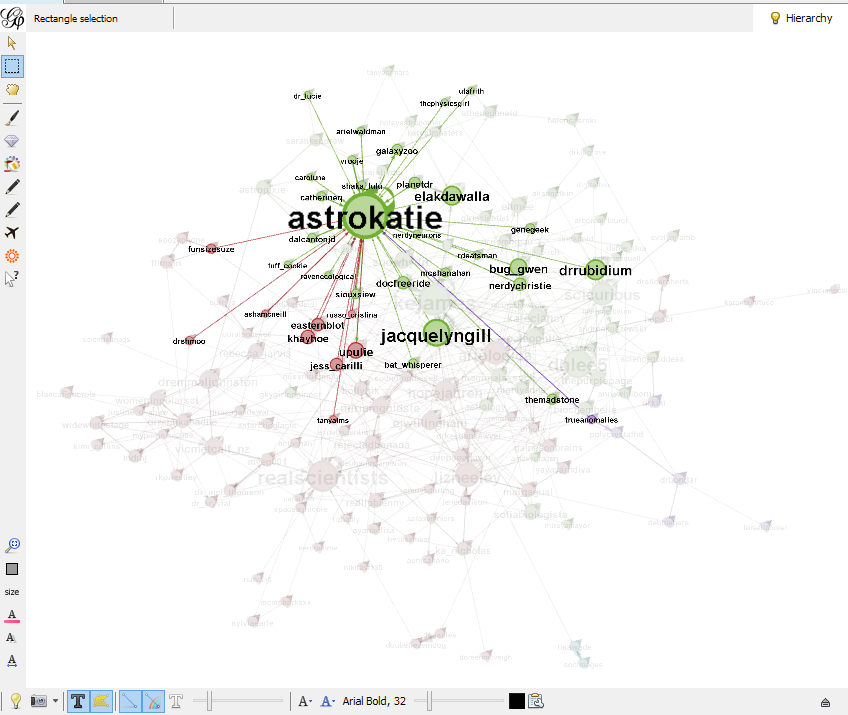
You can also run a “label adjust” algorithm under the “Layout” tab to adjust the position of the nodes so that you can better see their labels.

Now we can see that the most mentioned (or tweeted to, replied to, retweeted, etc.) node in this list of Twitter users over the last 100 tweets per user is AstroKatie. Other users with high in-degrees include RealScientists and Kejames. (If you want to see what kind of relationship each edge represents, whether it was a mention, tweet to or reply, you can find that information under the ‘Data Table’ tab on the top panel, above the Gephi graph. Just go to Data Table > Edges, and look for the column called ‘Relationship’.)
If we want to get really fancy, we can start looking for communities of users in this network. You can do this under ‘Statistics’ > Modularity. Click ‘run’ next to modularity. You’ll be prompted to enter a ‘resolution’ – the lower the number is, the more refined the detection of communities. But if you go too low, you might detect communities that aren’t really there, i.e. you are placing users into different communities even if they actually interact a great deal with users outside of the modularity class, or auto-detected community. Selecting a number around 5.0 is considered to be standard for detecting communities based on modularity class. Because I have a very dense network, I’m going to select a modularity class resolution of 3.0. This gives me 4 communities in my main dense cluster.
After you run Modularity, go back to the right-hand side panel and select the “Partition” > Nodes tab. If you click refresh, ‘Modularity Class’ should be an option in the pull down menu. Click Apply if you are happy with the colors.

Modularity measures the strength of division of a network into clusters, or communities. Networks with high modularity (with a maximum modularity score of 1) have dense connections or edges between the nodes within communities but sparse connections or edges between nodes in different communities. The modality score of the WomenTweetScience Too network is .389 (see under ‘Statistics’ tab). This is a relatively low modularity score, meaning users are forming a network that is mostly inter-connected.
You might note that in the graph above, we no longer see the users on the outskirts who are not connected to the core cluster. You can filter out the individual nodes that are not connected to anyone else in the network by going to the ‘Filters’ tab on the right-hand side panel of Gephi, and navigating to topology > giant component. Drag and drop the giant component into the lower left-hand box. Now if you click ‘filter’, only the more densely-connected core of nodes will show up in your network graph. This makes detecting and coloring modularity class communities a bit easier.
Now you can play around with your network! Using the arrow question-mark icon on the right-hand panel of your graph view, you can select any node to see who that node represents, how other nodes connect to that node, what the in-degree and out-degrees scores are for that node, etc.
Finally, to save your network graph as an image, go to File > Export > SVG/PDF/PNG file, and save in the file format you’d like. The PDF file offers a higher resolution graphic of your network map. You can preview and modify the exported graphic under the “Preview” tab at the top of the Gephi workspace. You may have to play around with the preview settings to get the graphic to look how you want it to look.

And that’s how you create a social network map! Have questions? Tweet to me @FromTheLabBench.